UX Case Study
UX Case Study
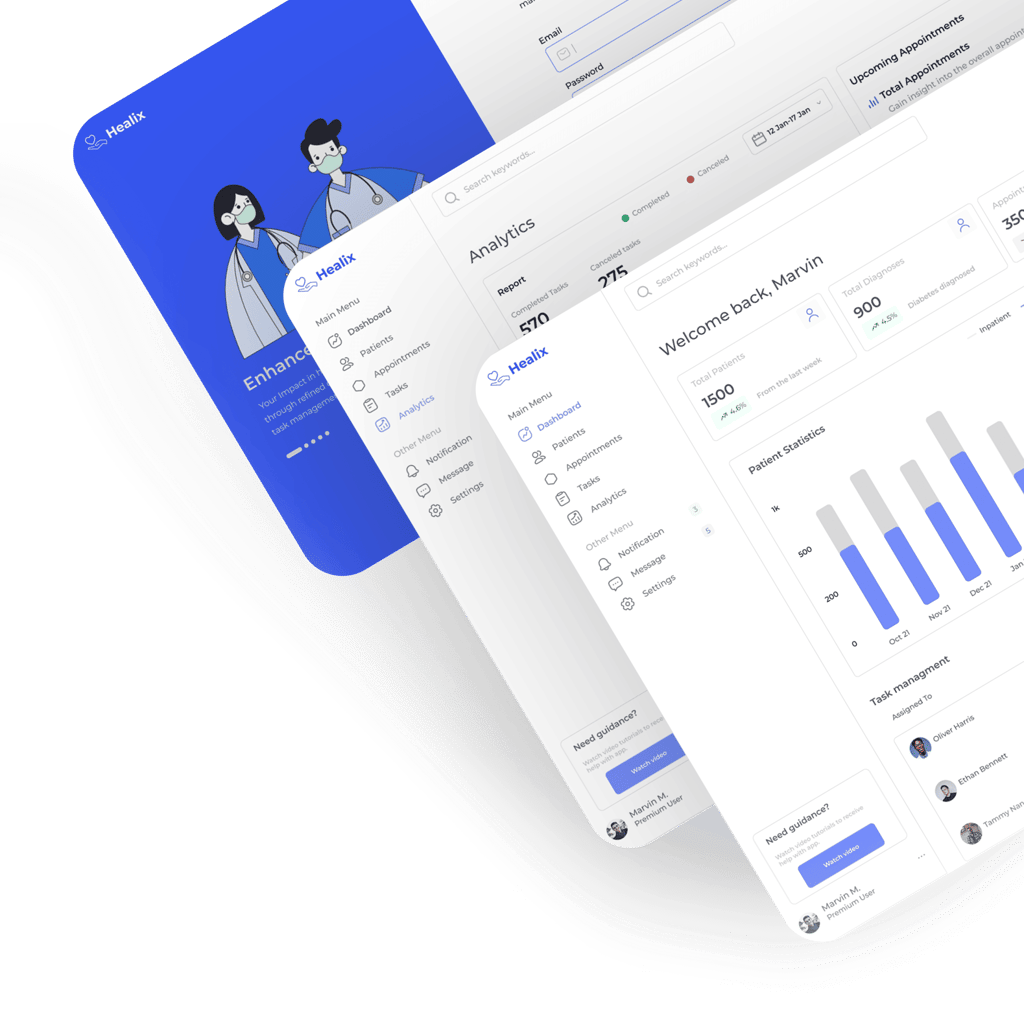
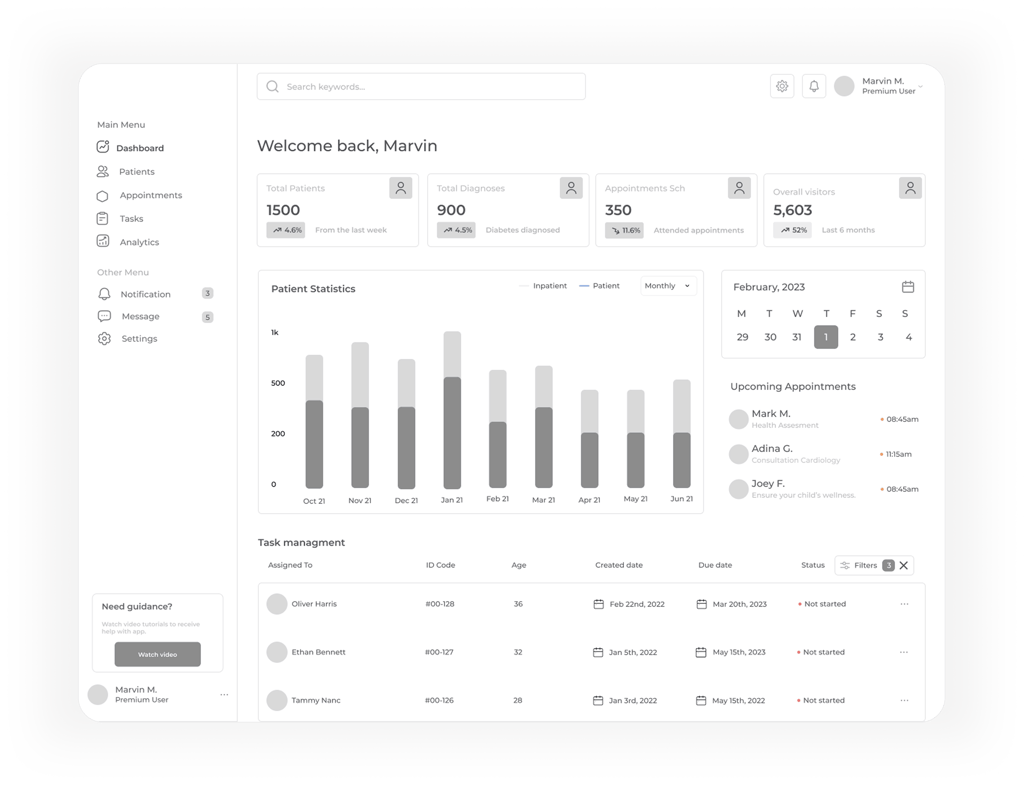
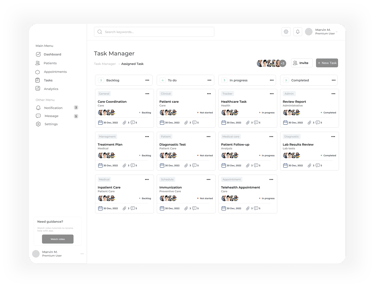
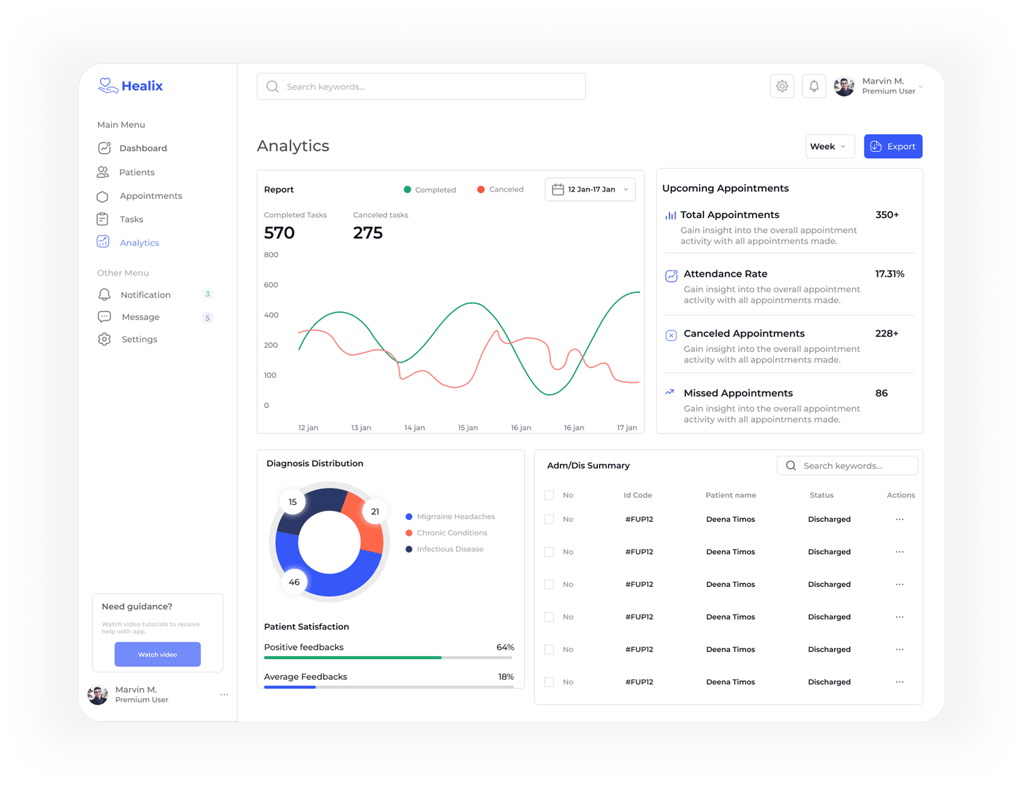
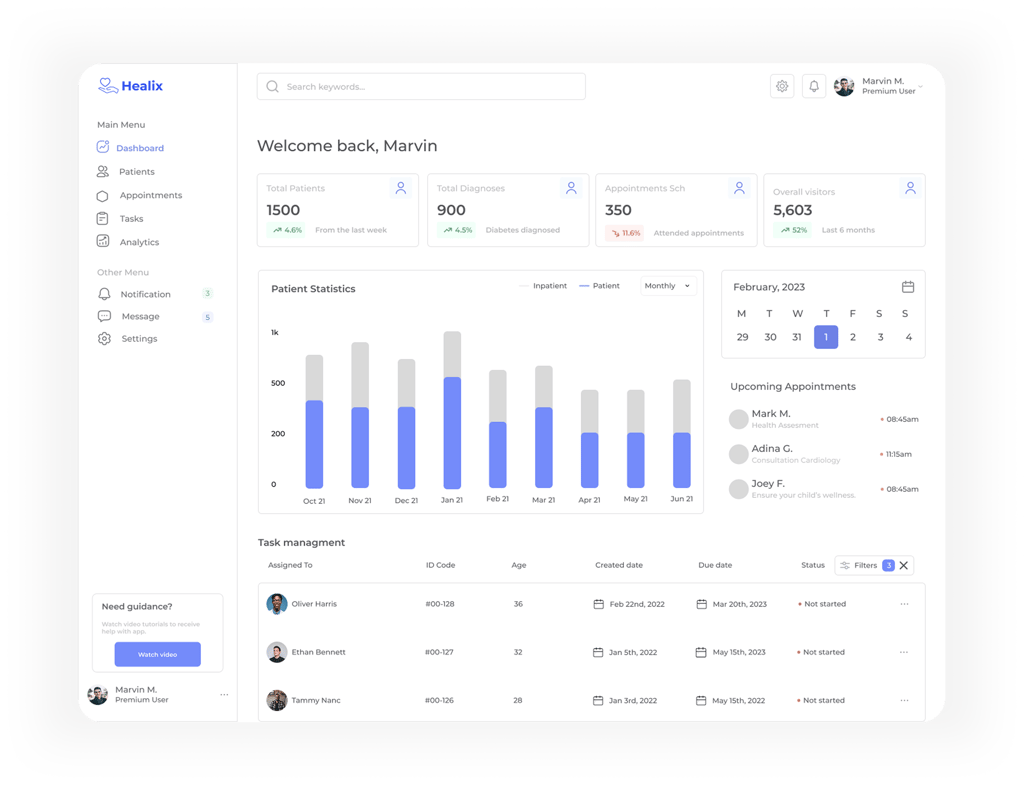
Healix Dashboard
Problem Statement
"Healthcare professionals struggle with disconnected systems
that
hinder patient tracking and team collaboration."
Business Goals
Provide an integrated healthcare management platform that simplifies data tracking, analytics, and collaboration.
Increase operational efficiency and data-driven decision-making for clinics and healthcare providers.
Enhance transparency and communication between departments (doctors, nurses, administrators).
Build trust through a seamless, intuitive, and secure digital experience.
Reduce administrative workload by automating repetitive data tasks.
Our Process


Discover
Define
Ideate
Design
Business Challenges
Managing sensitive healthcare data securely while maintaining usability (HIPAA/GDPR compliance).
Integrating with existing EHR (Electronic Health Record) systems.
Balancing data visualization complexity with clarity.
Ensuring adoption across tech-savvy and non-technical healthcare staff.
Maintaining consistent UI across multiple devices (desktop/tablet).
Product User's
Product users are individuals who use a product to
meet their needs or achieve specific goals.
Quantitative Research
68% of healthcare workers find their current dashboard difficult to navigate.
Average time spent on administrative tasks per day: 4.2 hours.
68%
56%
56% desire visual analytics and exportable reports.
40%
Conversion goal: reduce time on administrative reporting by 40%.
72%
72% report frustration switching between different tools for analytics, scheduling, and reporting.
based on analytics data
User Need's
Quick access to patient data and analytics.
Simple task assignment and management.
Ability to generate reports quickly.
Secure cloud-based data sharing.
Role-based access control for different staff levels.
Integration with scheduling and communication tools.
Features & Functionalities
To resolve user needs
Dashboard Overview: Summary of key metrics (appointments, patients, performance trends).
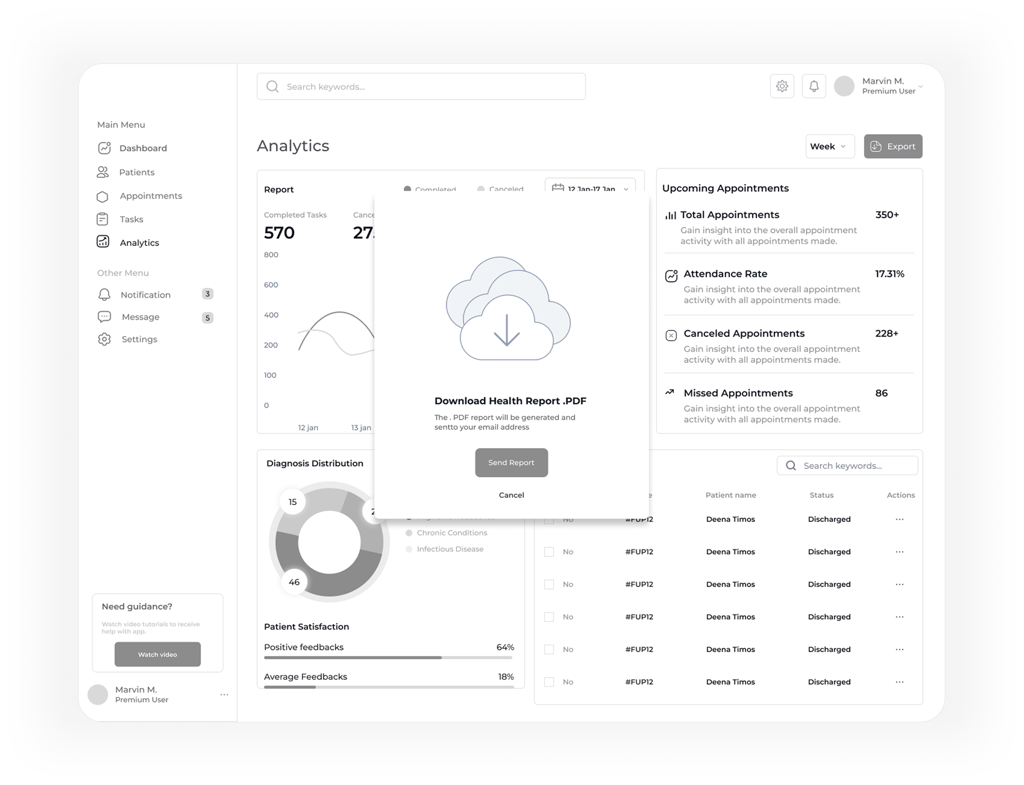
Analytics Module: Graphs for patient statistics, appointment trends, and satisfaction analysis.
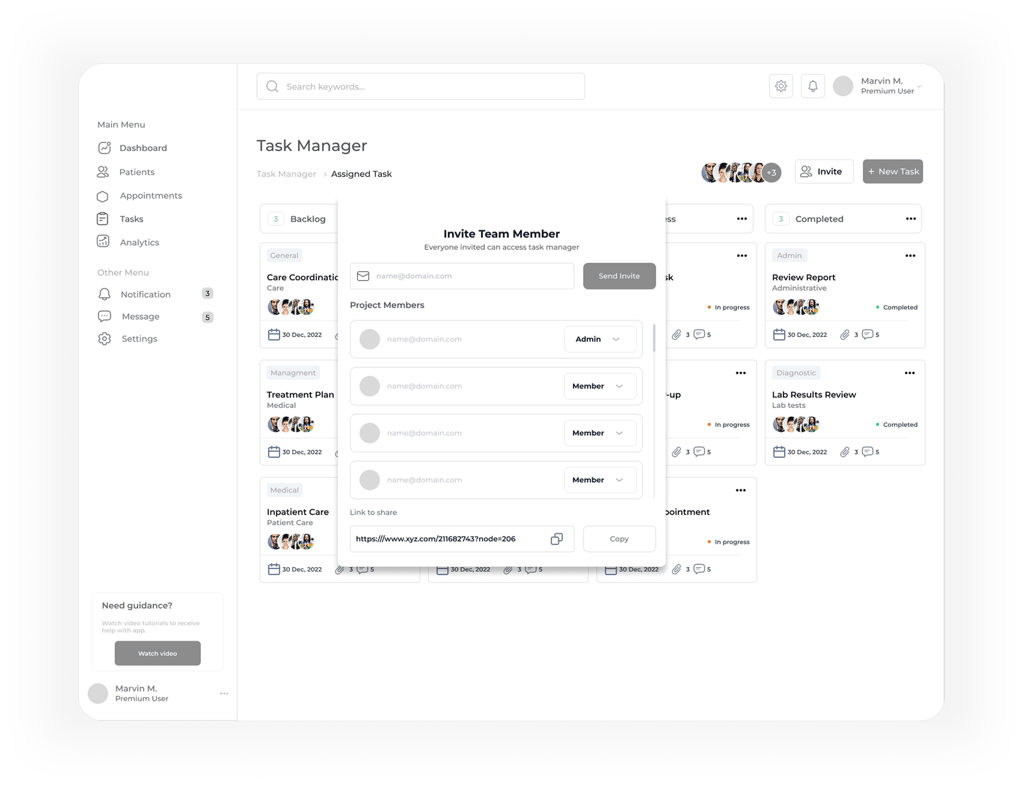
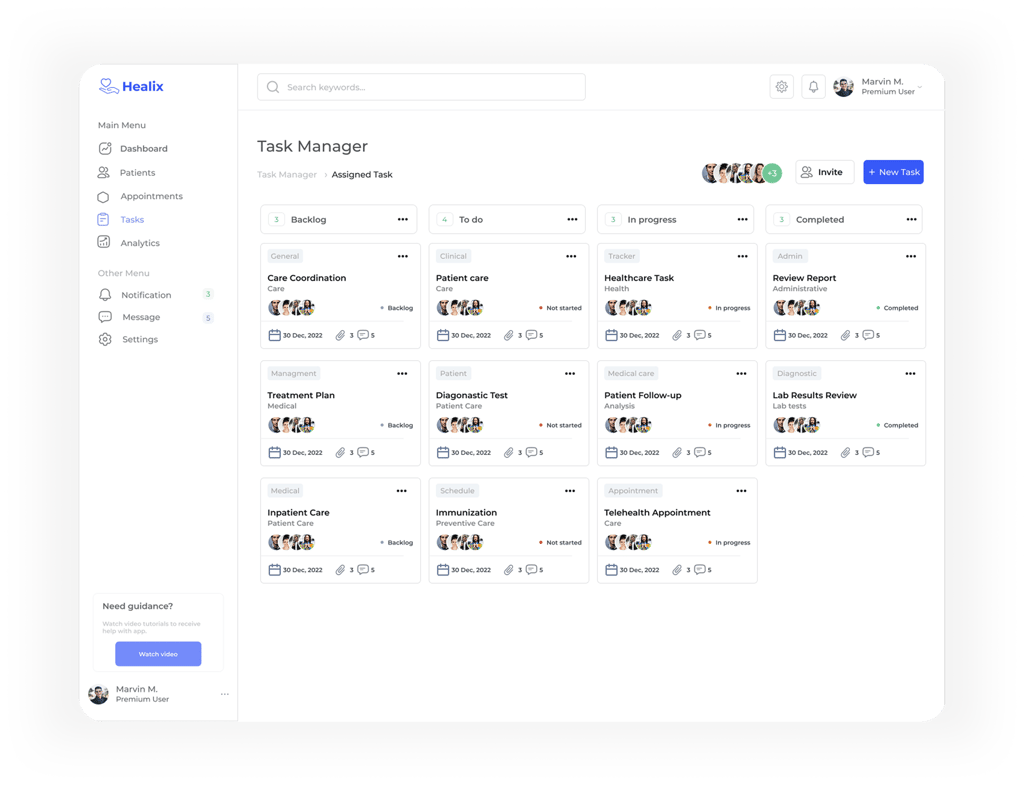
Task Manager: Kanban-style task cards for medical and admin teams.
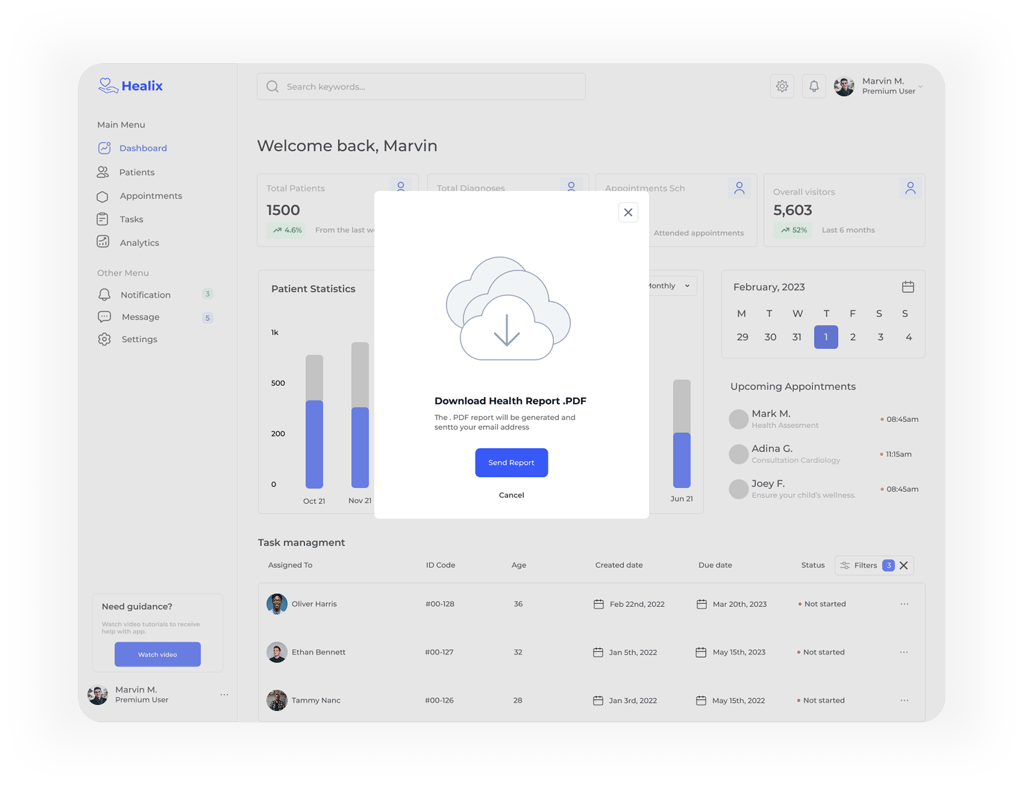
Reports Download: Generate and export PDF reports with a single click.
User Management: Invite and manage team members with permissions.
Notifications System: Alerts for appointments, reports, and collaboration updates.
Dark/Light Mode: Enhances usability in clinical environments.
Product User Challenges
Overwhelming data visualization and unclear navigation hierarchy.
Inconsistent access to reports or missing export functions.
Poor team collaboration and unclear task ownership.
Difficulty adapting to digital tools for older healthcare staff.
Limited integration with external hospital systems.
Competitor Analysis
Athenahealth
Appointment management
Features :
Patient records
Performance metrics
Real-time patient data
Kareo
Calendar scheduling
Analytics
Claims management
Charting
NextGen Healthcare
Features :
Financial & clinical dashboards
Patient outcomes tracking
Robust data visualization
Integrations with many systems
SimplePractice
Features :
Calendar
Billing
Telehealth
User Reviews & Ratings
Features :
Unique Features
Unified ecosystem combining analytics, reporting, and team task management in one platform.
Modular, card-based UI adaptable to different roles.
One-click report download and team invitation workflows.
Custom data visualization tailored for healthcare KPIs.
Scalable architecture for hospitals and small practices alike.
User Persona 1
Goals
Track patient outcomes and satisfaction trends in real time.


Access accurate analytics to make data-driven clinical decisions.
Ensure accountability among staff and smooth interdepartmental communication.
Frustrations:
Patient data scattered across multiple disconnected systems.
Manual report creation takes hours, limiting patient-facing time.
Difficult to identify underperforming areas due to poor visualization tools.
Dr. Emily Carter
Senior Physician
About
27
Detroit
Physician
Employee
Motivation
Wants to improve patient care through insights and transparency.
Desires a tool that saves time and supports evidence-based practice.
Feels motivated when technology simplifies her daily workload.
User Persona 2
Goals
Optimize team efficiency through better task management.
Access consolidated performance metrics to guide operational strategy.
Streamline reporting and communication between departments.
Frustrations:
Current tools lack synchronization — causing delays and data duplication.
Difficult to track team accountability and project completion status.
Constantly switching between spreadsheets, email, and dashboards.
Alex Kim
Operations Manager
About
34
Detroit
Manager
Employee


Motivation
Motivated by achieving operational excellence and measurable productivity gains.
Feels empowered when workflows are transparent and automated.
Takes pride in leading a data-informed and collaborative team.
User Persona 3
Goals
Easily view and complete assigned daily tasks.
Communicate efficiently with the medical team about updates or changes.
Stay organized and avoid missing deadlines or critical updates.
Frustrations:
Overwhelmed by cluttered interfaces and too many options.
Unclear task assignments lead to confusion and duplicated effort.
Lack of real-time notifications causes missed updates or miscommunication.
Sarah Lopez
Healthcare Assistant
About
28
Detroit
MBBS
Employee


Motivation
Motivated by completing tasks efficiently and receiving recognition from supervisors.
Feels accomplished when work tools are intuitive and help her perform faster.
Enjoys being part of a team where collaboration feels seamless and productive.
Task Mapping
User Task
Goal
Barriers
Opportunities
Access Patient Overview Dashboard
Access real-time insights into patient statistics and outcomes.
Data scattered across multiple legacy systems.
Create centralized data visualization dashboards.
Filter and Compare Data
Drill Down into Individual Patient Records
Generate and Export Analytical Reports
Identify trends in patient satisfaction and appointment efficiency.
Support data-driven decision-making for treatment improvements.
Simplify reporting to reduce administrative workload.
Overly complex dashboards causing cognitive overload.
Inconsistent or delayed data synchronization.
Limited data export and sharing capabilities.
Simplify data filters and search for quicker insights.
Enable automated report generation and exports.
Implement role-based dashboard views for clarity and relevance.
Empathy Mapping
Says
Thinks
Feels
Does
“It takes too long to find the information I need.”
“I need a clear overview of patient data without wasting time navigating multiple tools.”
“Why can’t this platform just give me a simple overview?”
“Once it’s easier to use, the whole team will get on board.”
“I wish we could assign and track tasks more efficiently.”
“Technology should simplify my work, not make it more complicated.”
“Accurate data helps me make better decisions and improve overall patient outcomes.”
“Our team would be more efficient if tasks, analytics, and reports were all in one place.”
“Overwhelmed by constant switching between dashboards, reports, and communication tools.”
“Frustrated when systems are slow, confusing, or filled with unnecessary features.”
“Confident and in control when data and workflows are streamlined and visually clear.”
“Anxious about missing deadlines or overlooking important updates.”
“Frequently checks the dashboard for updates on patients”
“Exports reports manually to share with team members or management.”
“Collaborates through chats or meetings to fill communication gaps caused by the software.”
“Creates workarounds (like spreadsheets) to track progress when the system is unclear.”
Taskflows
Scenario 1 :
Primary Task Flow: Book a Vehicle
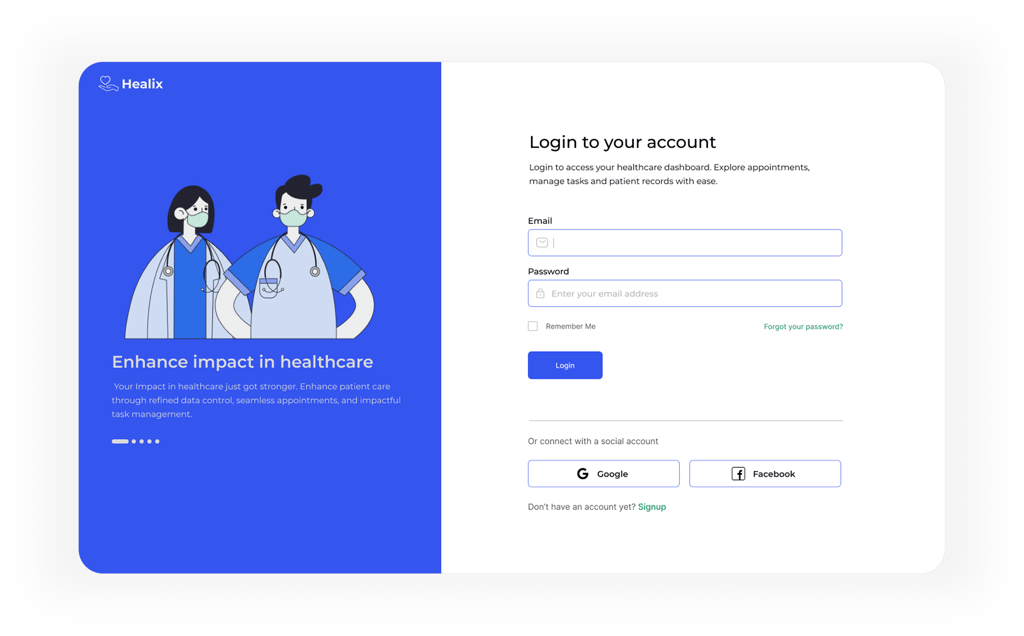
User enters credentials
System verifies
Main dashboard
Filters
Views metrics
Analytics
Downloads or shares report.
Task Manager
Creates or assigns tasks
Updates progress
Invites members
Download Report
Confirmation modal appears
Userflow
Login / Sign Up
Dashboard
View Task Board
Logout
Create Task
Check Analytics
Assign to Member
Export Report
Wireframe’s
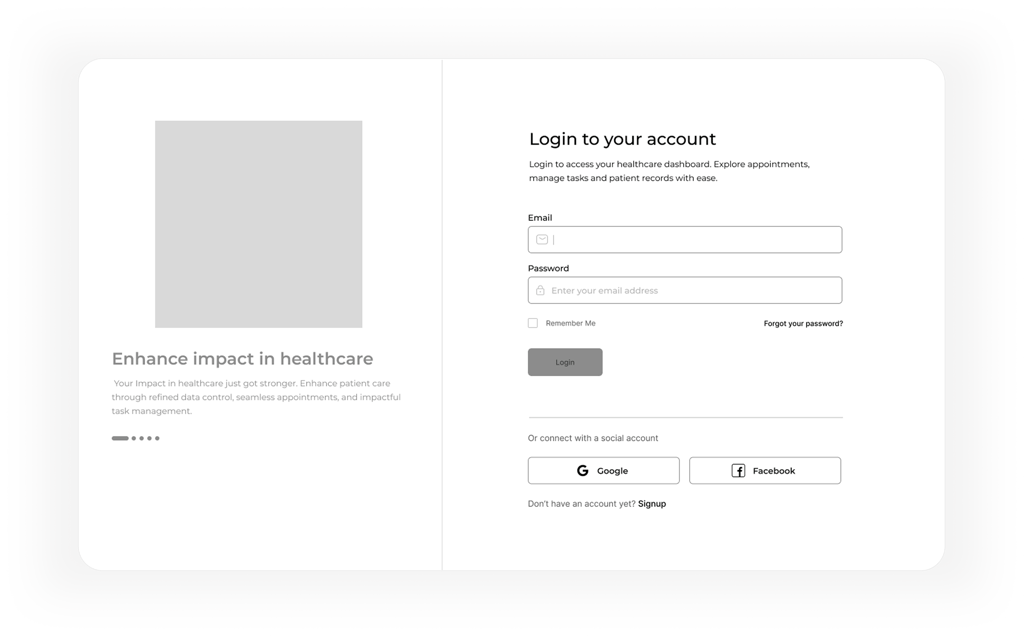
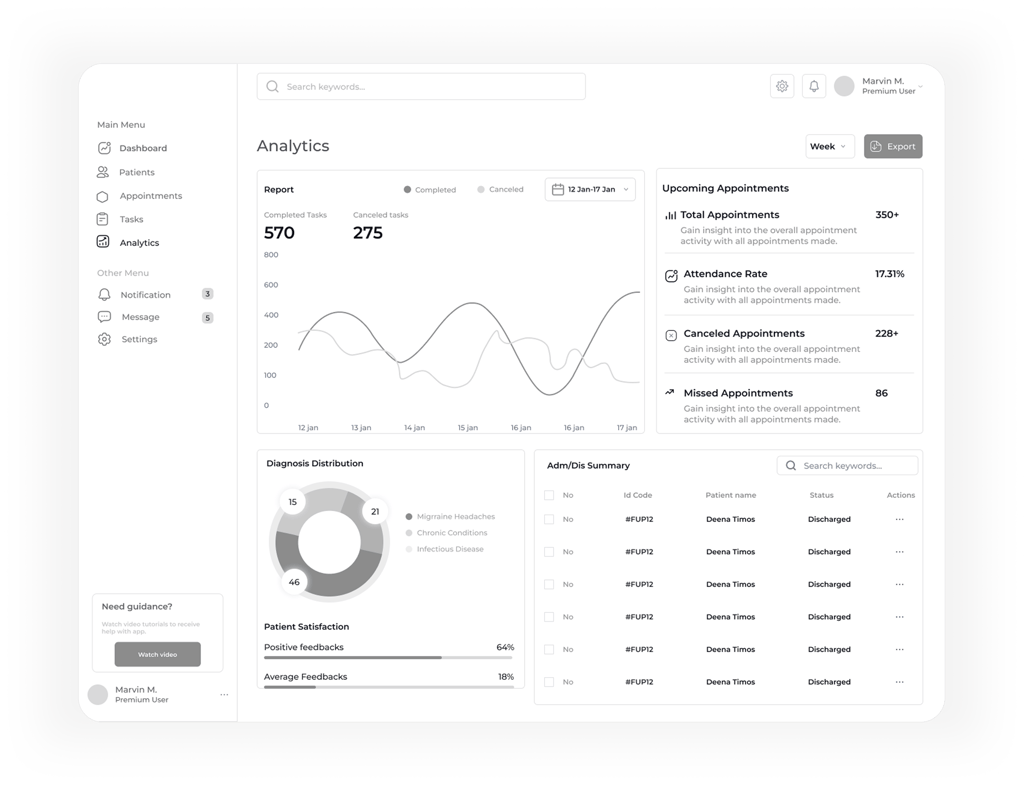

Screen's

Contact Us
info@11evendesign.com
Stay Connected with Us
+91-9923290627